

What is Power BI?
p>Power BI online training is the best way to get to grips with this data analysis tool. Power BI is powerful business intelligence (BI) tool, and what's super cool is that it is free to download.Power BI allows you to import data from pretty much any source. Computer Tutoring's Excel Power BI course uses data from Excel making it easy for you to produce fully interactive charts and visualisations. That's right you can click on them and filter tables, pie charts, donut charts, tree diagrams and maps with "LIVE" data.
- Analyse your data more efficiently
- Spot trends and patterns in your data
- Obtain actionable insights to make better business decisions
What is Power BI Desktop?
Power BI comes in 2 parts, online and desktop. The desktop part of Power BI is a free piece of software you can download and install to run on your machine. The idea being that you create and perfect your dashboards before you share them by publishing them online.
After you've created a dashboard you can be proud of, you can then click on the publish button to publish the dashboard online. Once the dashboard is online, you can start sharing.
What is Power BI Pro?
This is the full paid version of Power BI. It is a cloud-based self-service analytics too. It allows you to use the dashboards you've either published or created online to be embedded into apps, shared with users and intergrated with other Microsoft solutions.
What is Power BI Premium?
Power BI Premium is the version best suited for larger enterprise organisations with many users. Consider it a super upgrade of Power BI Pro. On top of the features and functionality you'd receive in Power BI Pro, you also receive increased data capacity limits, maximum performance, access to one API service, and many other features.
Power BI Fully Interactive Dashboard Examples
See for yourself what Power BI is capable of by playing with these interactive examples. Click on the charts and see how the dashboard changes to reflect the data you have selected.
Power BI Key Benefits
The Excel Power BI online training courses is one of our most popular courses. This is because armed with Power BI skills you will discover actionable insights in your data. This will help you make business decisions so you can plan ahead.
Power BI - Top Ten Benefits
- Accessible anytime, anywhere
- Create customisable dashboards
- Free access to hundreds of powerful data visualisations
- Links to live data
- Easy to use
- API's to integrate with over 150 different data sources
- Secure report publishing
- Simple drag and drop functionality
- No upfront costs
- Constant innovation
Power BI Online Training - Benefits
A Power BI online training course will give you a headstart with this powerful data modelling and analysis application. So whether you're an absolute beginner, or you are looking to improve your DAX skills we have the Power BI training course for you.
- Live online instructor
- Learn from anywhere
- Ask questions, get immediate answers
- Post training support
- Course notes
- Online certificate
Plus, as the name suggests, a Power BI "online" training course gives you the opportunity to learn Power BI from anywhere. All you need is a computer and an internet connection.
Additionally, all Power BI online training courses are instructor led. That's right! A live experienced Power BI trainer will be teaching the course. This gives you the opportunity to ask questions and get immediate answers. Along with free post training course support you'll have a firm start in the world of data modelling and analysis using Power BI.
Power BI Online Training - Beginners Course Summary
You've got to start somewhere, and the Power BI online training course for beginners is the natural place to start. Also, if you feel that your Power BI skills need a bit of polishing, you will definately not be disappointed. This is because Power BI is constantly being updated, so you might want to ensure you're aware of Power BI's latest features.
Highlights - What Will I Learn in a Beginners Power BI Online Training Course?
- See how to get data from Excel
- Use basic formulas
- How to work with visualisations
- How to create dashboards
- Understand how to use filters in Power BI
- See how to create relationships
- Learn how to publish Power BI Online
View Power BI Online Training Full Course Outline
By the end of the beginners Power BI online training course you will be able to create a simple dashboard with data imported from Excel. You will also know how to publish and share that data online.
Power BI Online Training - DAX Course Summary
The DAX (Data Analysis Expressions) Power BI online training course will help you get to grips with the formula side of Power BI. This will help make visualisations work for you.
Highlights - What Will I Learn in the DAX Power BI Online Training Course?
- Understanding DAX
- Creating DAX formulas
- Writing a YTD (Year-To-Date) formula
- Using time intelligence functions
- How to rank in DAX
- Measures vs. Calculated Columns
- Learn how to create Measures
- Understanding the evaluation context
- How to use the Quick Measure feature
View Power BI DAX Training Course Full Course Outline
By the end of the DAX course you will understand how to use DAX to get more from Power BI. Creating formulas using Time Intelligence and Filters to get answers you need from the data. In other words DAX is magic that enables you to have an additional layer of control over your dashboards.
What Version of Power BI do I Need for the Online Training Course?
You will need the desktop version of Power BI for the training. This can be downloaded for free.
Before you download Power BI it's a good idea to check whether you're using the 32bit or 64bit version of Microsoft Office. See Access Database Installation Error video to understand more about why this is important with Microsoft Access.
Where Can I Download Power BI?
Download from the Microsoft Website.

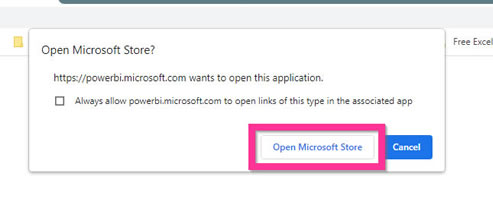
You can then choose to download Power BI using the Microsoft Store.
Click on the Install Button. After Power BI has been installed you can click on the launch button to start the program.

How to install Power BI help video.
Most Popular Power BI Terms
| Term | Description | Benefits in the Work Environment |
|---|---|---|
| BI | Business Intelligence | Uses software that transforms you data into insights for you to take action on. BI analyses data sets and presents findings in reports, dashboards and summaries. |
| DAX | Data Analysis Expressions | DAX is a Microsoft Developed language that works with Power BI along with other software applications. It's purpose is to enable users to easily write formulas that are designed to handle data. This way you can get your visualisations working for you |
| KPI | Key Performance Indicators | A KPI is a way of measuring performance by setting targets. It could be as simple as a colour change in a visual if total revenue has reached a certain target. Or it could be used to inspired your staff to make progress, meet targets so that you company grows. |
| PBIX | Power BI XML | The standard file format for a Power BI file. The X in the file name stands for XML which is the native file format for all latest office documents. (e.g. docx, xlsx, pptx). |
| PBIVIZ | Power BI Visual | The file format for Power BI visualisations. These can be download from the Microsoft marketplace, or created from scratch. |
| SaaS | Software As A Service | SaaS is a way of delivering applications over the internet. Power BI online is an example of this being a web based service. Other examples are Microsoft Forms and Sway |
DAX Common Functions
- Aggregation Functions
Aggregation functions return a value applying to an entire column or expression. The most common such function in SUM(). - Date and Time Functions
Date and Time functions help to create formulas that are based on time. E.g. how many sales did we make last month compared to this month? What are the year to date sales? - Filter Functions
Filter functions manipulate the context of tables. For example, how much money did we make from red products
=FILTER(factSales,factSales[colour]="Red"). - Financial Functions
Allows you to run specific financial calculations on a data set. For example, if you want to work out the monthly payment of a loan.
=PMT(
Loans[Rate],
Loans[Nper],
Loans[PV],
Loans[FV],
Loans[Type]) - Information Functions
Provides information about data type or filter context. - Logical Functions
Return a value based on a condition. The most common would be the IF function. =IF([SalesDate]>=TODAY(),"Future","Past"). - Math and Trig Functions
The mathematical functions in DAX are very much like Excel. E.g. =ROUND([DecimalToWhole],0).